Friday, September 23, 2016

GIS Internship!

Hello there!


Image result for great hill trails bridgewater ma
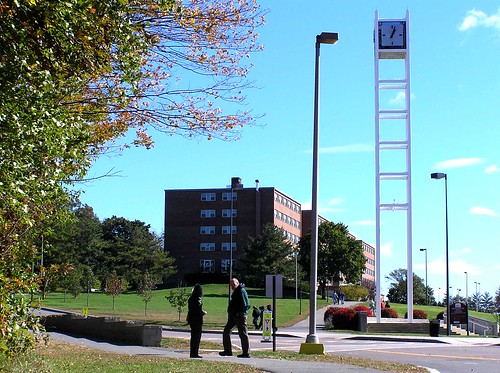
 The former clock tower at BSU
 
It sure has been a while since I last posted something on here...I apologize as I was very busy this summer working and planning my upcoming wedding!

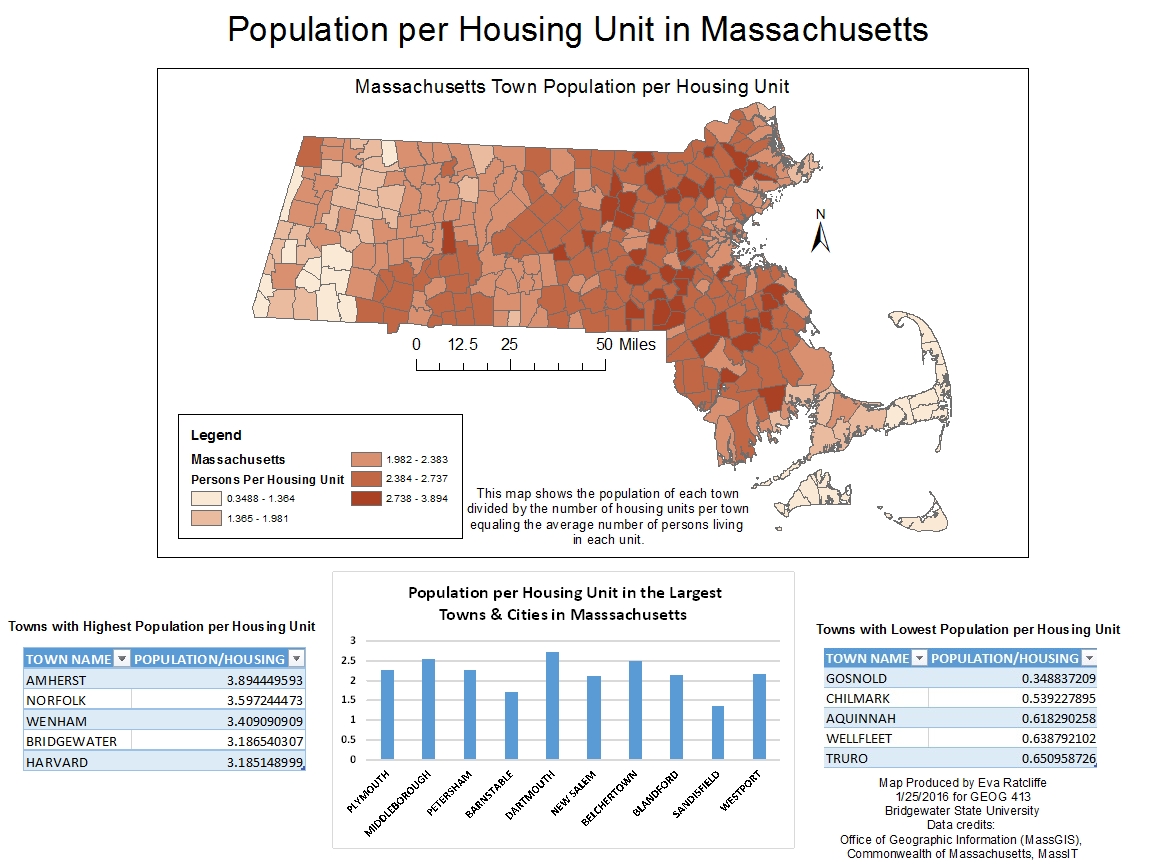
Over this summer though I was able to work with the Director of the Fitness Center at BSU on updating the Great Hill Trail map that he and a former Geography student had created years back. The maps had been updated in 2013 but they needed a little revamp, especially considering that these maps were now going to have a designated spot at the trail head for hikers to take along with them. The map needed additions on two of the trails, objects needed to be removed from the map such as the clock tower, and the map display needed to be set on legal sized paper with an accordion fold. I worked on the map from about late June to late July and am happy to say that the map is on display at the Great Hill Trails trail head at Bridgewater State University and is also online on BSU's Athletic & Recreation's official website!

In other exciting GIS news, I went in for an interview at the North Attleboro Electric Department (on my birthday) for their GIS intern position. I left for Maine a few days later and got a phone call that I got the internship for the Fall semester! I of course took the offer and have been interning here since Sept 7th. My manager is even a graduate of BSU's Geography program. So far, I have been working on a map for a certain area in town making sure that the electrical account numbers match up with the spreadsheet of accounts and vice versa.
Image result for electricity
It is very cool to be able to apply the skills that I have learned in the classroom outside in the real world in a job setting. I am definitely fortunate and blessed that I have been given these great opportunities to use my GIS skills outside of school. I am excited to see where my journey with Geography and GIS will take me in the future!


For now, keep checking back here as I will post updates often as I am getting course credits for my internship and keeping up with this blog is part of what is required of me!


(: Eva

Wednesday, March 30, 2016

Great Blue Hill, Viewshed Analysis on ArcScene

Hello all!

For this week's homework, I was to create a Viewshed Analysis using ArcGIS online and ArcScene. I decided that I would do a Viewshed Analysis of The Great Blue Hill in Milton, Massachusetts. 
Blue Hill
                                   
What is a Viewshed Analysis you ask? Well, suppose you were 5'5" tall and decided to hike up to the top of the 635 foot tall Blue Hill, what would you see if you were to look across the landscape? The Viewshed Analysis tells you just that. On ArcGIS online, you are able to choose any location across the world and place in certain parameters to get the Viewshed Analysis for your selected area. For mine, I chose that the person standing on top of the Great Blue Hill would be 5'5" and that at most, they could see 9 miles out. Below is the Viewshed Analysis for the Great Blue Hill. The orange spots are the areas that you would be able to see. I haven't been up to to the top of the Great Blue Hill in a long time, I'd love to take a hike soon and see how far out I can see! 


Sunday, March 27, 2016

Solar-Wind Village Suitability in Adams, Ma

Happy Easter! 
I hope that you all are enjoying this beautiful Easter Sunday!

The most recent map that I have made for GIS dealt with the potential for a Solar-Wind Village Development in Adams, Massachusetts. I needed to find the locations in town that met the following criteria:

1. The site has to have a slope angle of 20° or less 
2. The slope has to have a southerly aspect (135° to 225°)
3. The wind speed at 30 m has to be above 5 m per second. 

I also needed to specify which locations were "highly suitable", "suitable" or had "limited suitability". The determinations for 

I was given an elevation raster of Adams and from that raster I needed to determine the slope and the aspect of the area. I then needed to obtain the wind speed raster from MassGIS and clip this New England raster down to just Adams.

Once I had found found the aspect of the Adams elevation raster, I used the raster calculator to get a layer of the wind speed and aspect that met criteria #2. I was then able to combine this layer with the slope layer that I had made through the process of determining the slope, reclassifying, and using the raster calculator on that layer. By combining these two layers I had a correct picture of all the criteria met, I just needed to reclassify it again so that the labels would be correct. 

Below is my finished map:

Sunday, March 13, 2016

Nunckatessett Greenway Map Journal

Hi all!

I'm sorry that I haven't been written since mid-February, my life has been very crazy!

Anyway...recently I have been working on the Nunckatessett Greenway Project and the last step of the project was to create a map journal on ArcGIS. 

To view my map journal please click here!

I hope that you enjoy the map journal! This project for class was certainly hard but rewarding! I'm happy to have had the opportunity to work on and improve my GIS skills while working on a real life project. 


Friday, February 19, 2016

Nunckatessett Greenway Parcel Project

This has been one of the more difficult maps that I have ever made on ArcMap. 

There is a group of people from Bridgewater, Massachusetts who have proposed that a Greenway be built through the towns of Bridgewater and West Bridgewater along the Town River. This Greenway would be called the Nunckatessett Greenway and would serve both communities as a walking/biking/running/exploration trail. The goal of the Nunckatessett Greenway project is to promote the natural resources that our around us in the town and bring more businesses and attract more visitors with what the Greenway has to offer. 

This project has been ongoing for the past 10 years and this year the plan is picking up speed with the interest of both town governments. 

For this project, we were asked to find parcels in Bridgewater and West Bridgewater that met criteria for the Greenway and give them a number of 1 if they met that criteria, or 0 if they did not. The criteria were as follows: parcels located within 600 feet of the river, parcels located within 600 feet of a river access point, parcels designated as an area of environmental concern (ex. wetlands, woodlands), parcels that are owned by the state, town, or United States government, and finally parcels with land use codes such as hiking, biking, retail space, residential, recreation...In total we had 7 different criteria that we had to search for in each town's attribute table. Once all of this data was coded, a column titled "Sum" was created so that we could see how many different criteria each parcel met. 

The map below is showing each parcel that either meets, no criteria, 1 criteria, 2, 3, or 4 criteria. It is colored using the gray scale, darker gray meaning that parcel meets more criteria. Along with this map, a table of the parcel ID and the owners of each parcel has been created so that the next step in creating this Greenway can be reached by getting in contact of the parcel owner's and explaining the proposed Nunckatessett Greenway to them. 

To learn more about the Nunckatessett Greenway Project please visit their website here


Persons Per Housing Unit in Massachusetts

Below you will find a chloropleth map that I have created showing the Population per Housing Unit in Massachusetts. 

The map shows each town or city colored a shade of red based on the average number of persons living in a housing unit in that city or town. I have also included two tables describing the five towns with the highest amount of persons per housing unit and the five towns with the least amount of persons per housing unit. In addition to the tables, there is also a bar graph showing the persons per housing unit in the 10 largest cities and towns (size based on square miles not population). 

I hope you enjoy the map!


Demographics Map of Bristol, Plymouth & Barnstable Counties

Below you will find a poster that I created for class that describes the demographics of the 10 cities in Bristol, Plymouth, and Barnstable Counties in Massachusetts. The map symbols for the cities are sized based on the population from the 2000 census, while I have also made two bar graphs representing the racial/ethnicity makeup of each city and the housing situation. The data for the map came from ESRI.  I hope that you enjoy the map!


Monday, February 15, 2016

Amusement Parks I've Visited

Below is a map that I have created using ArcGIS online. It displays 10 amusement and water parks that I have visited. 

We didn't have much fun on the
log flume at Canobie!


Of these parks, my favorites have and always will be Story Land in Glen, New Hampshire and Santa's Village in Jefferson, New Hampshire. I started going to both parks when I was 18 months old and went every year until I was 12. While I am definitely too old to enjoy the parks, I cannot wait until I am married (next year!) and start a family of my own so that my future children will enjoy the parks just as I have. 

The most recent park I visited was Canobie Lake Park in Salem, New Hampshire. I was there this past August with my fiancee, my best friend, and her boyfriend.  

My least favorite parks were Hershey Park and Funtown Splashtown USA. I did not enjoy either because I was sick, one from allergies (Hershey Park...I claim to be allergic to Pennsylvania) and the other from motion sickness. Not fun!! But I would give both another chance. 

I would love to get back to Colorado so that I can maybe revisit those amusement parks that I visited in 2006 and add more parks to my map!!


Tuesday, February 9, 2016

UFO Sightings in the USA

Here is my first map ever created using ArcGIS online, it is a map of the UFO sightings across the United States from 1941 to 2014. The data I used for my map came from wikipedia.

Thursday, January 28, 2016

Map #1

Welcome back! 

For my first map making assignment this semester, I was to make a map of Massachusetts where the towns and cities are colored based on the population in 2010. The catch being that I could only use colors along the gray scale.

For the map, I used data from the Office of Geographic Information (MassGIS) and the Commonwealth of Massachusetts, MassIT. I decided to create a choropleth map using graduated colors (the gray scale) and breaking it into 5 classes. The cities and towns with the lowest populations are shaded in the light gray while the cities and towns with the highest populations are shaded in the dark gray. Here is my completed work for the assignment:
 

Keep checking back for my next map! 

Let Me Introduce Myself

Hello fellow bloggers and internet users! 

My name is Eva and I am a Geography Major at Bridgewater State University in Bridgewater, Massachusetts. I am also minoring in Sustainability and Innovations Outreach.


This semester I am taking a course called "Applications in Geographic Info Systems" or otherwise referred to as GIS. For the class I am required to blog about my experiences making maps and doing spatial analysis through ArcMap. 

While I envision myself working either in Emergency Management or Environmental Protection, being able to use GIS and understand it is critical to my future endeavors. I'll be keeping this blog up to date with maps that I have created so come follow me on this adventure!

If you would like to follow along on another adventure of mine here at the University, I am the primary author of the BSU EarthView blog which is updated every Thursday or Friday and discusses where our famous EarthView globe will be traveling to!

I look forward to keeping you all updated on my GIS adventures this semester!